
Probability for fantasy picks is one number: the chance your lineup or pick cashes. The single most useful thing you can do with that number is compare expected value across contest options before you enter. EV = Σ(probability of each finish × payout) − entry fee. If EV > 0, the play is profitable over many iterations. If it is negative, skip it or find a better spot.
Stat to know: Peer-reviewed research in the Journal of Sports Analytics confirms that salary-cap fantasy contests are skill-dominant. Random lineups perform far worse than skilled strategies over the long run, which means probability estimates and EV calculations are not optional extras. They are the actual edge.
Large-prize wins are a different story. Analyses show top-prize odds in big contests can fall well below 0.001%, making single jackpots statistical outliers rather than a reliable target.
Table of Contents
- What probability concepts do fantasy players actually need?
- How do you calculate EV and use it to pick contests?
- How does strategy change between cash games and tournaments?
- How do you turn projections into actual win probabilities?
- How can partner sites surface probability and EV to boost engagement?
- Quick checklist for players and partners
- How were the numbers in this guide derived?
- Key Takeaways
- Why EV and embeddables are the right focus
- Megasports-arena gives players and partners a live EV edge
- Useful sources
What probability concepts do fantasy players actually need?
An event is any outcome you can assign a likelihood to: a player scoring 30+ points, a lineup finishing in the top 10%, a pick cashing. Probability is a number between 0 and 1 expressing how often that event occurs across many trials.
Independence vs. correlation is where most casual players go wrong. Two events are independent when one does not affect the other. In a lineup, a quarterback and his wide receiver are correlated: when the QB throws for 350 yards, the receiver likely benefits too. Stacking correlated players raises your ceiling in tournaments because their scores move together. In a 50/50, that same correlation increases variance, which is usually the last thing you want.

Variance is the spread around your expected score. A high-variance lineup might score 180 or 80; a low-variance lineup clusters near 130 every week. Neither is universally better. The right choice depends on contest type.
A few misconceptions worth clearing up:
- "A player hit 40 points last week, so he will again." One result does not validate a model.
- "Higher projection always means higher win probability." Not true in tournaments where ownership matters.
- "Correlation only matters in large GPPs." It affects EV in any multi-player lineup format.
- "Variance is bad." In top-heavy tournaments, variance is a feature, not a bug.
How do you calculate EV and use it to pick contests?
EV is the primary long-run metric in fantasy contests. The formula:
EV = Σ (P(finish) × Payout) − Entry Fee
Walk through a concrete example. Suppose a double-up contest has 574 contestants and pays 250 winners. The empirical win probability is roughly 0.4355 (250 ÷ 574). A $5 entry in a double-up that pays $9 to winners looks like this:
| Outcome | Probability | Payout | EV Component |
|---|---|---|---|
| Win (cash) | 0.4355 | $9 | — |
| Gross EV | — | ||
| Entry fee | −$5 | ||
| Net EV | −$1.08 |
That net EV of −$1.08 is negative because platform rake reduces the prize pool. Always subtract the entry fee and account for rake before deciding a contest is worth entering. A contest with a 10% rake needs a win probability above the break-even threshold just to reach zero EV.
For a tournament, the math is the same but the finish distribution is wider. You sum EV components across every payout tier: first place, second place, min-cash, and so on. Most of the EV in a top-heavy GPP lives in the top 1–3 finishes, which is why ceiling and variance matter there.
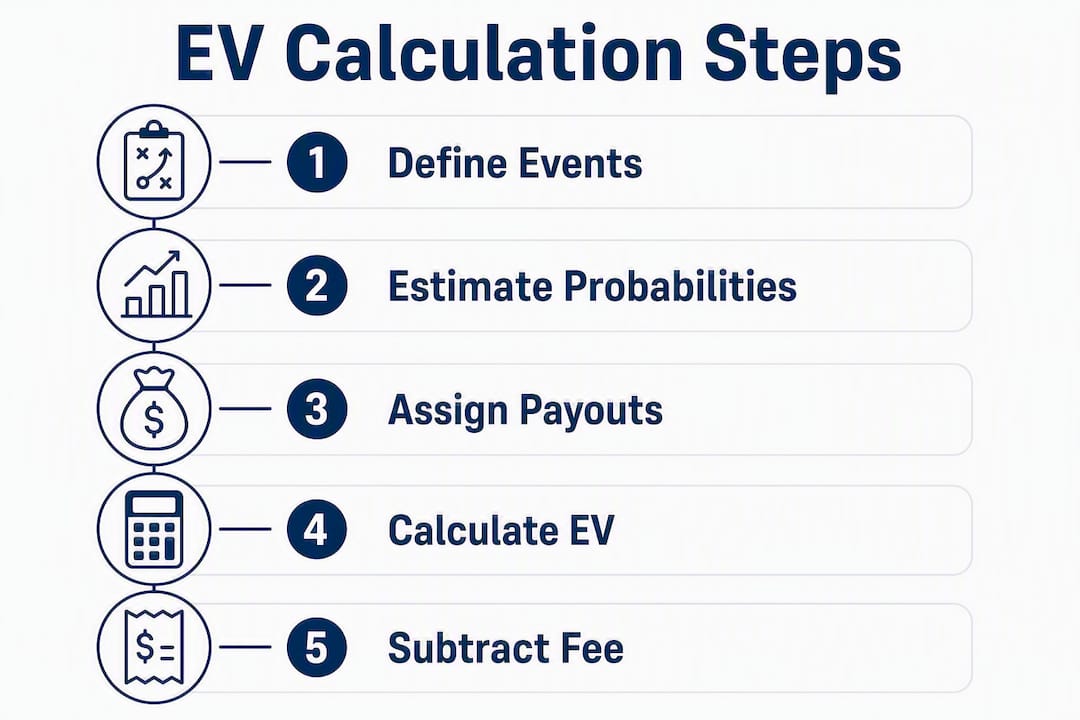
Steps to replicate this yourself:
- Pull the payout structure and field size from the contest lobby.
- Estimate your probability of finishing in each paid tier.
- Multiply each probability by its payout and sum the results.
- Subtract the entry fee. If the result is positive, the contest has positive EV.
Pro Tip: Cap total contest entries at a percentage of your bankroll that lets you survive a losing stretch. A common rule of thumb is no more than 5–10% of your bankroll in any single slate, spread across contest types.
How does strategy change between cash games and tournaments?
Cash games and tournaments require opposite builds. Getting this wrong is the most common EV leak in fantasy.
Cash games (50/50s, double-ups, head-to-heads): You need a floor, not a ceiling. The goal is to beat roughly half the field consistently.
- Prioritize players with reliable, high-probability scoring floors.
- Avoid boom-or-bust plays even when their projection is high.
- Minimize correlated stacks that add variance without raising your floor.
- In head-to-heads, study your opponent's likely build and target players they will not use.
Tournaments (GPPs): You need ceiling and differentiation.
- Stack correlated players (QB + WR, pitcher + offense) to create score spikes.
- Target low-owned players with similar projections to high-owned ones. This is leverage: if that player outperforms, you are one of few lineups to benefit.
- Avoid the most popular plays unless their projection justifies the ownership cost.
- In large-field GPPs, a lineup that mirrors the field cannot win the field.
Pro Tip: In a large GPP, a 20% ownership player with a projection 5% below the chalk can have higher EV than the chalk if the field is heavily concentrated on that chalk. Ownership-adjusted EV, not raw projection, is the number that matters.
Survivor pools and elimination formats add another layer: your probability of surviving each round compounds, so a single bad pick ends your run regardless of EV in prior rounds.
How do you turn projections into actual win probabilities?
Three practical approaches, ordered by complexity:
-
Score-distribution approximation. Treat each player's projected score as the mean of a normal distribution with a standard deviation estimated from historical variance. Sum the lineup's components (accounting for correlation) to get a lineup score distribution. The probability of cashing is the area of that distribution above the expected cash line.
-
Poisson or normal approximation for totals. For sports where scoring is count-based (goals, strikeouts), a Poisson model fits naturally. For continuous scoring (fantasy points), a normal approximation is faster and usually accurate enough for contest-level decisions. Monte Carlo simulations and Poisson-binomial approximations are the practitioner standard for head-to-head categorical matchups in MLB, NBA, and NHL.
-
Monte Carlo contest simulation. Simulate the full contest thousands of times. Each iteration draws a score for every lineup from its distribution, ranks them, and records your finish. After 10,000 iterations, your win probability is the fraction of simulations where you finished in a paid position. Inputs: player projections, standard deviations, correlations, field size, and payout structure. Output: a finish-probability distribution you can plug directly into the EV formula.
When to use which: the normal approximation is fast enough for pre-slate decisions on cash games. Monte Carlo is worth the extra time for large GPPs where ownership and correlation interact in ways a simple approximation misses.
Pro Tip: Backtest your probability model against six to twelve months of historical slates. If your estimated 60% cash-rate lineups are actually cashing at 45%, your floor estimates are too optimistic. Calibration beats raw projection accuracy.
How can partner sites surface probability and EV to boost engagement?
Embedding probability and EV visuals turns passive readers into active participants. The retention case is concrete: returning users generate substantially more entries than new users when social-first mechanics are in place. A strong first-play conversion rate and a significant marketing opt-in rate have been recorded for integrated fantasy and predictor games aligned with live competition moments.
Widgets worth deploying:
- Odds/EV board: shows live win probabilities and EV estimates for current contests. Partners can embed the Megasports-arena Odds Board directly.
- Pick probability badges: small inline labels showing a player's or team's estimated win probability, updated as news breaks.
- Lineup EV calculator: lets users input their lineup and see estimated EV before submitting.
- Mini-league leaderboard widget: surfaces standings in private leagues, driving return visits. Leaderboard gamification is one of the strongest documented retention mechanics in fantasy sports.
UX notes that matter: label every probability with its update timestamp. Mobile-first layout is non-negotiable since most fantasy activity happens on phones. Keep privacy and consent disclosures visible, especially for any widget that collects user data. Pick'em and social-first formats are absorbing the fastest growth among next-generation players, so lightweight prediction widgets reach exactly the audience partners want.
Quick checklist for players and partners
For players, before entering any contest:
- Estimate win probability for your lineup in that specific contest structure.
- Compute EV using the payout table and your probability estimates.
- Match your build to the contest type: floor for cash, ceiling and leverage for GPPs.
- Size entries within your bankroll limit.
- After the slate, compare projected vs. actual scores to calibrate your model.
For partner sites, before deploying an embed:
- Decide which metrics to surface: win probability, EV, leaderboard rank, or all three.
- Set an update cadence that matches the sport's pace (pre-game, in-game, post-game).
- Instrument engagement tracking so you can measure return visit rate and entries per user.
- Link to a custom pool builder so users can create their own contests.
Red flags to avoid:
- Ignoring ownership in tournament EV calculations.
- Overfitting projections to recent small samples.
- Forgetting to subtract rake when computing net EV.
How were the numbers in this guide derived?
The double-up example uses a field of 574 contestants and 250 paid positions, drawn directly from published contest data. The win probability of 0.4355 is the ratio of winners to entrants. The $5 entry and $9 payout are illustrative round numbers chosen to show a realistic rake scenario. Changing field size, payout multiplier, or rake percentage changes the EV outcome proportionally.
Simulation and approximation methods can diverge when player score distributions are skewed or when lineup correlations are high. In those cases, Monte Carlo tends to be more accurate because it captures the full shape of the distribution rather than assuming normality. For most cash-game decisions, the normal approximation is close enough.
"Statistical tests in peer-reviewed research demonstrate that random play's long-run performance is far worse than skilled strategies in salary-cap contests." — Journal of Sports Analytics
Key sources supporting this guide: the Stokastic EV methodology, the Journal of Sports Analytics skill-vs-chance study, the Strategy Boffins analysis of win probability and rake, and the Dizplai engagement case study. Fantasy scoring systems affect which probability model fits best, so review your platform's scoring rules before building a model.
Key Takeaways
Using EV as your primary decision rule, matched to contest type and adjusted for rake and ownership, is the single practice that separates consistent fantasy performers from the field.
| Point | Details |
|---|---|
| EV is the core metric | Compute EV = Σ(P × Payout) − Fee before every entry; skip negative-EV contests. |
| Build matches contest type | Cash games need high-floor lineups; GPPs need ceiling, correlation, and low-ownership leverage. |
| Ownership adjusts EV | A contrarian pick with similar projection to chalk can have higher tournament EV due to reduced field overlap. |
| Embeds drive retention | Returning users generate substantially more entries than new users when social-first mechanics are active. |
| Megasports-arena for partners | The Odds Board and embeddable game widgets let partner sites surface live probabilities and EV to boost engagement immediately. |
Why EV and embeddables are the right focus
The conventional wisdom in fantasy sports coverage is to chase projections. Find the highest-projected player, build around him, repeat. The problem is that projection-first thinking ignores the two variables that actually determine whether a lineup makes money: the probability distribution around that projection and the ownership concentration in the field.
A player projected at 32 points who is owned by 45% of the tournament field is a worse EV play than a player projected at 30 points owned by 8% of the field, assuming similar variance. The math is not subtle. Yet most content in this space still leads with raw projections and treats probability as an advanced topic for later.
The same logic applies to partner sites. Showing users a static projection list keeps them on your page for thirty seconds. Showing them a live EV board with pick probability badges and a mini-league leaderboard keeps them coming back for the next slate, and the one after that. Engagement is not a soft metric here. It is directly tied to entries, opt-ins, and ad revenue.
The responsible caveat: variance is real, and even positive-EV plays lose frequently in the short run. Treat contests as entertainment with a skill component, size entries accordingly, and never enter a contest with money you cannot afford to lose.
Megasports-arena gives players and partners a live EV edge
Free-to-play fantasy and prediction games across MLB, NBA, NFL, and NHL are available on Megasports-arena right now, with no entry fee and no paywall. For partners, the real value is in the embed layer: the Odds Board surfaces live probability data your audience can act on, and the game widgets drop directly onto any sports page without custom development.

The pick'em and mini-league formats are built specifically for the social-first engagement loop that drives return visits. A partner site that embeds a leaderboard widget gives users a reason to check back after every game, not just before it. That is the retention mechanic that turns a one-time visitor into a regular.
Start with the Sports Rummy play page to see how a free-to-play game runs end-to-end, or load the Odds Board to preview the live probability display your users would see. Both are live and embeddable today.
Useful sources
- Journal of Sports Analytics: skill vs. chance in DFS
- Strategy Boffins: Probability of Winning in Online Fantasy Sports
- Dizplai: Turning Fans into Active Participants
- Matchup Win Probability Methodology (GitHub)
- Fantasy Sports Statistics 2026: Users, Revenue & Trends
- Megasports-arena Odds Board
- Sports Rummy: How to Play
Five research sources back the core claims in this guide. See the methodology section for the assumptions behind the worked examples and how to adjust them for your own contest structure.